Chapter Headings
Key Messages
- Optimal glycemic control is fundamental to the management of diabetes.
- Both fasting and postprandial plasma glucose levels correlate with the risk of complications and contribute to the measured glycated hemoglobin (A1C) value.
- Glycemic targets should be individualized based on the individual's frailty or functional dependence and life expectancy.
Key Messages for People with Diabetes
- Try to keep your blood glucose as close to your target range as possible. This will help to delay or prevent complications of diabetes.
- Target ranges for blood glucose and A1C can vary and depend on a person's medical conditions and other risk factors. Work with your diabetes health-care team to determine your target A1C and blood glucose target range (fasting and after meals).
Introduction
Optimal glycemic control is fundamental to the management of diabetes. Regardless of the underlying treatment, glycated hemoglobin (A1C) levels >7.0% are associated with a significantly increased risk of both microvascular and cardiovascular (CV) complications (1–3). The initial data from the Diabetes Control and Complications Trial (DCCT; type 1 diabetes) (2) and the United Kingdom Prospective Diabetes Study (UKPDS; type 2 diabetes) (3) demonstrated a curvilinear relationship between A1C and diabetes complications, with no apparent threshold of benefit, although the absolute reduction in risk was substantially less at lower A1C levels. Similarly, both fasting plasma glucose (FPG) and postprandial plasma glucose (PPG) are directly correlated to the risk of complications, with some evidence that PPG might constitute a stronger independent risk factor for CV complications (4–10).
Evidence indicates that improved glycemic control reduces the risk of both microvascular and CV complications. The initial prospective randomized controlled trials were conducted in people with recently diagnosed diabetes. These trials—the DCCT in type 1 diabetes (11), the Kumamoto trial (12) and the UKPDS (1,13) in type 2 diabetes—confirmed that improved glycemic control significantly reduced the risk of microvascular complications, but had no significant effect on CV outcomes. Subsequent observational data from long-term follow up after termination of randomization periods of both the DCCT and UKPDS cohorts showed a persistence of significant microvascular benefits and also demonstrated an emergence of beneficial effect on CV outcomes attributed to intensive glycemic control. This has been termed as “metabolic memory” or “legacy effect” (14–16). In the DCCT cohort, there was a significant reduction in CV outcomes (42%), nonfatal myocardial infarct (MI), stroke and CV death (57%), as well as all-cause mortality (33%) in previously intensively treated participants compared with those who were previously in the standard arm (17–19). Similarly, there was a significant reduction in MI (15% to 33%) and all-cause mortality (13% to 27%) in the UKPDS cohort in participants who had been originally randomized to intensive treatment (16).
Whereas the UKPDS trial enrolled people with recently diagnosed type 2 diabetes, 3 major subsequent trials—the Action to Control Cardiovascular Risk in Diabetes (ACCORD), Action in Diabetes and Vascular Disease: Preterax and Diamicron MR Controlled Evaluation (ADVANCE), and Veterans Affairs Diabetes Trial (VADT)—examined the effect of intensive glycemic control on people with long-standing type 2 diabetes. The ACCORD trial randomly assigned 10,251 participants who had either a previous history of cardiovascular disease (CVD) or multiple risk factors for CVD, and a baseline A1C level ≥7.5% to intensive therapy targeting an A1C <6.0% or standard therapy targeting an A1C level of 7.0% to 7.9% (20,21). The mean age of participants was 62 years and the mean duration of diabetes was 10 years. A difference in A1C was rapidly obtained and maintained throughout the trial at 6.4% and 7.5% in the intensive and standard therapy groups, respectively. The primary composite major CV outcomes (nonfatal MI, nonfatal stroke or death from CV causes) were not reduced significantly in ACCORD (hazard ratio [HR] 0.90, p=0.16). The glycemic control portion of the trial was prematurely terminated after 3.5 years due to higher mortality (1.41% vs. 1.14% per year, HR 1.22) associated with assignment to the intensive-treatment arm (19,20). However, an observational follow up of the surviving ACCORD participants over a median of 8.8 years showed a neutral long-term effect of intensive glucose control on the composite outcome and all-cause mortality (HR 1.01, confidence interval [CI] 0.92–1.10) (22).
The ADVANCE trial randomly assigned 11,140 participants to standard (targeting A1C based on local guidelines) or intensive glucose control therapy aimed at reducing A1C ≤6.5% (23). Participants were ≥55 years of age with a history of major CV or microvascular disease or at least 1 other risk factor for CVD. The mean duration of diabetes was 8 years. After a 5-year follow up, mean A1C was 6.5% in the intensive group and 7.3% in the standard group. The primary outcome was a composite of microvascular events (nephropathy and retinopathy) and CV disease defined by major adverse CV events. There was significant reduction in the incidence of major microvascular events in the intensive control group, mainly through a 21% relative reduction in nephropathy (23); however, no beneficial effect of intensive glucose lowering was found on major CV events or all-cause mortality either during the trial or the subsequent median observational follow up of 5.4 years (24).
The VADT randomly assigned 1,791 United States military veterans with a mean duration of diabetes being 12 years and with poor glycemic control (≥7.5%) to either standard or intensive glucose therapy, which aimed for an overall reduction in A1C levels by 1.5% (25,26). The mean duration of diabetes was 12 years and the A1C levels achieved in the standard and intensive therapy groups were 8.4% and 6.9%, respectively. During a median follow up of 5.6 years, there was a nonsignificant reduction in the primary outcome (first occurrence of a major CV event), but the progression to albuminuria was significantly reduced in the intensive-treatment participants, with 9.1% of participants having significantly reduced progression compared to 13.8% in the standard therapy group. However, during an observational median follow up of 9.8 years, the intensive-therapy group had a significantly lower risk of the primary outcome (MI, stroke, new or worsening congestive heart failure [CHF], amputation for ischemic gangrene, or CV-related death) than did the standard therapy group (HR 0.83, p=0.04), with an absolute reduction in risk of 8.6 major CV events per 1,000 person-years (27).
Data from a meta-analysis suggest that people with type 2 diabetes who receive intensive glucose lowering therapy have a reduced risk of the composite major adverse CV events (MACE) and MI, with no significant effect on the risk of total mortality, cardiac death, stroke and CHF (28). Although an explanation for the unexpected higher mortality rates associated with intensive-treatment in the ACCORD study remains elusive (29), the frequency of severe hypoglycemia in these trials was 2 to 3 times higher in the intensive therapy groups and a higher mortality was reported in participants with 1 or more episodes of severe hypoglycemia in the ACCORD (30), ADVANCE (31) and VADT trials (25), irrespective of the different treatment arms in which individual participants were allocated. Therefore, it has been suggested that a tight glycemic control with a target A1C of 6.0% may not be ideal for older/frail individuals, those with longer duration of diabetes, advanced coronary artery disease (CAD) and a known history of severe hypoglycemia (32,33) (see Diabetes in Older People chapter, p. S283; Hypoglycemia chapter, p. S104). Higher glycemic targets are also appropriate for functionally dependent adults of any age or individuals with limited life expectancy and little likelihood of benefit from intensive therapy.
Evidence also supports the use of multifactorial risk-reduction strategies in addition to A1C control for CV prevention, including blood pressure (BP) and lipid targets; CV prevention medications; physical activity and other healthy behaviours; as well as smoking cessation (see Cardiovascular Protection in People with Diabetes chapter, p. S162). Such multifactorial interventions have recently been suggested to lead to not only significant microvascular and CV benefits but also mortality reduction in the 21-year follow up of the Steno-2 study (34). The salient results of this study include: increased survival for a median of 7.9 years; 8.1 years longer median time before first CV event; and reduction in all microvascular complications, except for peripheral neuropathy, for participants in the intensive-therapy group compared to the conventional therapy group.
A1C measurement encompasses a component of both the FPG and postprandial PG. In addition, mean glucose values also correlate with A1C in both type 1 and type 2 diabetes as shown in Figure 1 (35,36). When A1C values are higher, the major contribution is the FPG levels, but as the A1C value approaches the target value of ≤7.0%, there is a greater contribution from PPG values (37–39). Another study using continuous glucose monitoring (CGM) demonstrated that a 2-hour PPG <8.0 mmol/L correlates best with an A1C <7.0% (40). In 1 study of forced intensified antihyperglycemic treatment in 164 participants with type 2 diabetes with A1C not at target (≥7.5%), achievement of a target A1C <7.0% was associated with a FPG target of <5.5 mmol/L in 64% of participants, and a PPG target of <7.8 mmol/L in 94% of participants (38). In addition, several insulin treat-to-target trials have safely used dose titration protocols in individuals not at target A1C to reach lower than “traditional” FPG and PPG targets, including: FPG levels of 4.5 to 5.5 mmol/L in participants with type 2 diabetes (41,42); FPG levels of 4.0 to 5.5 mmol/L in participants with type 2 diabetes (43–46); FPG levels of 3.9 to 5.0 mmol/L in participants with type 1 diabetes (47), as well as protocols targeting both FPG levels of 4.5 to 5.5 mmol/L and 2-hour PG levels of 5.0 to 7.0 mmol/L in participants with type 2 diabetes (48).
However, a major challenge in attempting to use evidence-based observations to determine the value of tighter PPG control has been the lack of well-designed, long-term outcome studies where assessing PPG values is the major objective of the study. Most of the large outcome trials conducted so far have been mostly based on preprandial glucose and A1C targets, with limited evidence of a long-term benefit of targeting PPG alone (49,50).
Although, nontraditional glycemic targets, such as fructosamine and glycated albumin, have also been associated with CV outcomes and mortality in a cohort study (51), the broader utility of such targets and their correlation with A1C has not yet been established.
Finally, glucose variability (GV) as an additional therapeutic goal has recently been gaining support. Limited data support the possibility that GV is involved in the pathogenesis of vascular complications of diabetes by inducing inflammatory activation and oxidative stress (52,53). Key components of GV (variability in FPG and PPG, as well as hypoglycemia) have received some prominence in clinical literature recently, linking these components to diabetes complications. In a cohort of >5,000 people with type 2 diabetes, time-dependent variation of fasting glycemia was a strong predictor of all-cause and CV mortality (53). Specific clinical targets suggested in the literature for people monitored via CGM include minimizing daily glucose standard deviation (SD) (to less than 3 times the mean BG), maximizing time in range (3.9 to 10 mmol/L) and minimizing hypoglycemia duration, severity and frequency. However, management strategies that would minimize glucose variability and their impact on hard clinical outcomes remain to be determined before these novel measurement targets of glucose quality can systematically be incorporated into clinical practice guidelines.
Figure 1
Recommended targets for glycemic control.
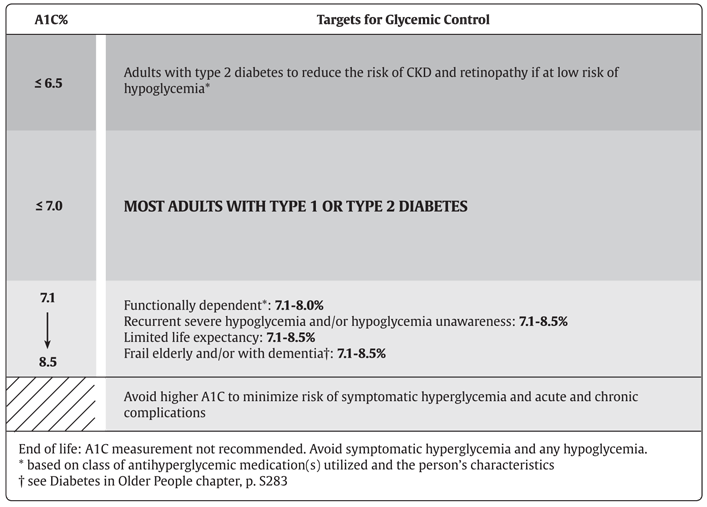
A1C, glycated hemoglobin; CKD, chronic kidney disease.
| Table 1 Correlation between A1C and estimated mean glucose values |
|||||
|---|---|---|---|---|---|
| A1C, glycated hemoglobin. | |||||
| A1C values (%) | 5.5–6.5 | 6.5–6.9 | 7.0–7.4 | 7.5–7.9 | 8.0–8.5 |
| Estimated mean glucose (mmol/L) | 6.2–7.7 | 7.8–8.5 | 8.6–9.3 | 9.4–10.1 | 10.2–10.9 |
Conclusions
Intensive glucose control with lowering A1C values to ≤7.0% in both type 1 and type 2 diabetes provides strong benefits for microvascular complications and, if achieved early in the disease with avoidance of hypoglycemia and glucose variability as part of a multifactorial treatment approach, likely provide a significant CV benefit. More intensive glucose control, A1C ≤6.5%, may be sought in people with a shorter duration of diabetes and longer life expectancy, especially in those people who are on treatment with antihyperglycemic agents with a low risk of hypoglycemia. An A1C target ≤8.5% may be more appropriate in people with type 1 and type 2 diabetes with limited life expectancy, higher level of functional dependency and a history of repeated severe hypoglycemia with hypoglycemia unawareness.
Recommendations
- Glycemic targets should be individualized [Grade D, Consensus].
- In most people with type 1 or type 2 diabetes, an A1C ≤7.0% should be targeted to reduce the risk of microvascular [Grade A, Level 1A (1,2,22,23)] and, if implemented early in the course of disease, CV complications [Grade B, Level 3 (23)].
- In people with type 2 diabetes, an A1C ≤6.5% may be targeted to reduce the risk of CKD [Grade A, Level 1A (23)] and retinopathy [Grade A, Level 1A (21)], if they are assessed to be at low risk of hypoglycemia based on class of antihyperglycemic medication(s) utilized and the person's characteristics [Grade D, Consensus].
- A higher A1C target may be considered in people with diabetes with the goals of avoiding hypoglycemia and over-treatment related to antihyperglycemic therapy, with any of the following [Grade D, Consensus for all]:
- Functionally dependent: 7.1%–8.0%
- History of recurrent severe hypoglycemia, especially if accompanied by hypoglycemia unawareness: 7.1%–8.5%
- Limited life expectancy: 7.1%–8.5%
- Frail elderly and/or with dementia: 7.1%–8.5%
- End of life: A1C measurement not recommended. Avoid symptomatic hyperglycemia and any hypoglycemia.
- In order to achieve an A1C ≤7.0%, people with diabetes should aim for:
- FPG or preprandial PG target of 4.0 to 7.0 mmol/L and a 2-hour PPG target of 5.0–10.0 mmol/L [Grade B, Level 2 (2) for type 1; Grade B, Level 2 (1) for type 2 diabetes]
- If an A1C target ≤7.0% cannot be achieved with a FPG target of 4.0–7.0 mmol/L and PPG target of 5.0–10.0 mmol/L, further FPG lowering to 4.0 to 5.5 mmol/L and/or PPG lowering to 5.0–8.0 mmol/L may be considered, but must be balanced against the risk of hypoglycemia [Grade D, Level 4 (38) for FPG target for type 2 diabetes; Grade D, Consensus for FPG target for type 1 diabetes; Grade D, Level 4 (38,40) for PPG target for type 2 diabetes; Grade D, Consensus for PPG target for type 1 diabetes].
Abbreviations:
A1C, glycated hemoglobin; BG, blood glucose; CGM, continuous glucose monitoring; CHF, congestive heart failure, CI, confidence interval; CKD, chronic kidney disease; CV; cardiovascular; FPG, fasting plasma glucose; GV, glucose variability HR, hazard ratio; MI, myocardial infarct; PG, plasma glucose; PPG, postprandial plasma glucose.
Literature Review Flow Diagram for Chapter 8: Targets for Glycemic Control
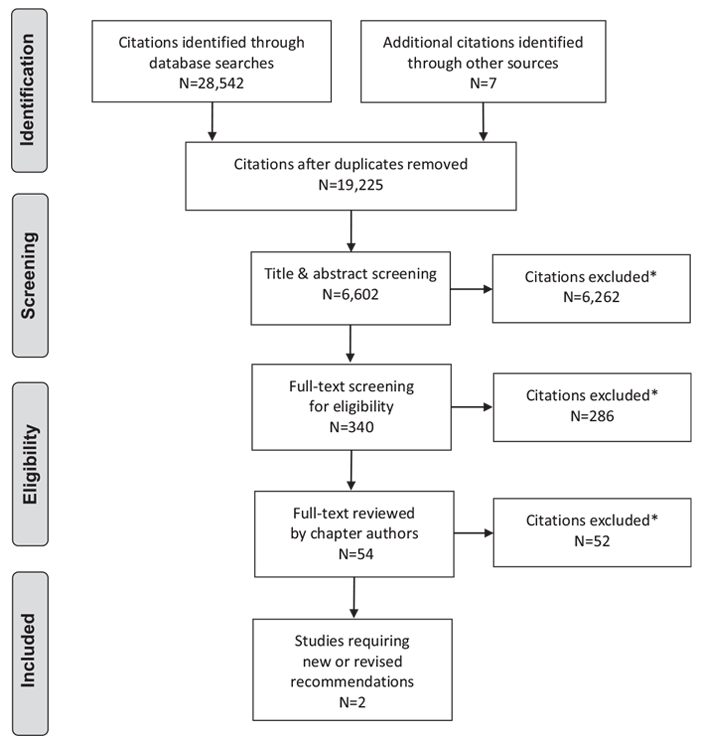
*Excluded based on: population, intervention/exposure, comparator/control or study design.
From: Moher D, Liberati A, Tetzlaff J, Altman DG, The PRISMA Group (2009). Preferred Reporting Items for Systematic Reviews and Meta-Analyses: The PRISMA Statement. PLoS Med 6(6): e1000097. doi:10.1371/journal.pmed1000097 (54).
For more information, visit www.prisma-statement.org.
Author Disclosures
Dr. Bajaj reports personal fees from Abbott; grants and personal fees from AstraZeneca, Boehringer Ingelheim, Eli Lilly, Janssen, Merck, Novo Nordisk, and Sanofi, outside the submitted work. Dr. Ross reports personal fees from Novo Nordisk, Eli Lilly, Janssen, AstraZeneca, and Boehringer Ingelheim, outside the submitted work. No other authors have anything to disclose.
References
- UK Prospective Diabetes Study (UKPDS) Group. Intensive blood-glucose control with sulphonylureas or insulin compared with conventional treatment and risk of complications in patients with type 2 diabetes (UKPDS 33). UK Prospective Diabetes Study (UKPDS) Group. Lancet 1998;352:837-53.
- The Diabetes Control and Complications Trial Research Group. The relationship of glycemic exposure (HbA1c) to the risk of development and progression of retinopathy in the diabetes control and complications trial. Diabetes 1995;44:968-83.
- Stratton IM, Adler AI, Neil HA, et al. Association of glycaemia with macrovascular and microvascular complications of type 2 diabetes (UKPDS 35): Prospective observational study. BMJ 2000;321:405-12.
- Service FJ, O’Brien PC. The relation of glycaemia to the risk of development and progression of retinopathy in the diabetic control and complications trial. Diabetologia 2001;44:1215-20.
- Coutinho M, Gerstein HC, Wang Y, et al. The relationship between glucose and incident cardiovascular events. Ametaregression analysis of published data from 20 studies of 95,783 individuals followed for 12.4 years. Diabetes Care 1999;22:233-40.
- Levitan EB, Song Y, Ford ES, et al. Is nondiabetic hyperglycemia a risk factor for cardiovascular disease? A meta-analysis of prospective studies. Arch Intern Med 2004;164:2147-55.
- Study DECODE, Group EDEG. Is the current definition for diabetes relevant to mortality risk from all causes and cardiovascular and noncardiovascular diseases? Diabetes Care 2003;26:688-96.
- Sorkin JD, Muller DC, Fleg JL, et al. The relation of fasting and 2-h postchallenge plasma glucose concentrations to mortality: Data from the Baltimore longitudinal study of aging with a critical review of the literature. Diabetes Care 2005;28:2626-32.
- Cavalot F, Pagliarino A, Valle M, et al. Postprandial blood glucose predicts cardiovascular events and all-cause mortality in type 2 diabetes in a 14-year follow-up: Lessons from the San Luigi Gonzaga Diabetes Study. Diabetes Care 2011;34:2237-43.
- Emerging Risk Factors Collaboration, Sarwar N, Gao P, et al. Diabetes mellitus, fasting blood glucose concentration, and risk of vascular disease: A collaborative meta-analysis of 102 prospective studies. Lancet 2010;375:2215-22.
- The Diabetes Control and Complications Trial Research Group, Nathan DM, Genuth S, et al. The effect of intensive treatment of diabetes on the development and progression of long-term complications in insulin-dependent diabetes mellitus. N Engl J Med 1993;329:977-86.
- Ohkubo Y, Kishikawa H, Araki E, et al. Intensive insulin therapy prevents the progression of diabetic microvascular complications in Japanese patients with non-insulin-dependent diabetes mellitus: A randomized prospective 6-year study. Diabetes Res Clin Pract 1995;28:103-17.
- Effect of intensive blood-glucose control with metformin on complications in overweight patients with type 2 diabetes (UKPDS 34). UK Prospective Diabetes Study (UKPDS) Group. Lancet 1998;352:854-65.
- Writing Team for the Diabetes Control and Complications Trial/Epidemiology of Diabetes Interventions and Complications Research Group. Effect of intensive therapy on the microvascular complications of type 1 diabetes mellitus. JAMA 2002;287:2563-9.
- Martin CL, Albers J, Herman WH, et al. Neuropathy among the diabetes control and complications trial cohort 8 years after trial completion. Diabetes Care 2006;29:340-4.
- Holman RR, Paul SK, Bethel MA, et al. 10-Year Follow-up of intensive glucose control in type 2 diabetes. New Engl J Med 2008;359:1577-89.
- Nathan DM, Cleary PA, Backlund JY, et al. Intensive diabetes treatment and cardiovascular disease in patientswith type 1 diabetes. N Engl JMed 2005;353:2643-53.
- Writing Group for the DCCT/EDIC Research Group, Orchard TJ, Nathan DM, et al. Association between 7 years of intensive treatment of type 1 diabetes and longterm mortality. JAMA 2015;313:45-53.
- Diabetes Control and Complications Trial (DCCT)/Epidemiology of Diabetes Interventions and Complications (EDIC) Study Research Group. Intensive diabetes treatment and cardiovascular outcomes in type 1 diabetes: The DCCT/EDIC study 30-year follow-up. Diabetes Care 2016;39:686-93.
- Action to Control Cardiovascular Risk in Diabetes Study Group, Gerstein HC, Miller ME, et al. Effects of intensive glucose lowering in type 2 diabetes. N Engl J Med 2008;358:2545-59.
- The ACCORD Study Group and ACCORD Eye Study Group. Effects of medical therapies on retinopathy progression in type 2 diabetes. New Engl J Med 2010;363:233-44.
- Action to Control Cardiovascular Risk in Diabetes Follow-On (ACCORDION) Eye Study Group and the Action to Control Cardiovascular Risk in Diabetes Follow-On (ACCORDION) Study Group. Persistent effects of intensive glycemic control on retinopathy in type 2 diabetes in the Action to Control Cardiovascular Risk in Diabetes (ACCORD) follow-on study. Diabetes Care 2016;39:1089-100.
- ADVANCE Collaborative Group, Patel A, MacMahon S, et al. Intensive blood glucose control and vascular outcomes in patients with type 2 diabetes. N Engl J Med 2008;358:2560-72.
- Zoungas S, Chalmers J, Neal B, et al. Follow-up of blood-pressure lowering and glucose control in type 2 diabetes. New Engl J Med 2014;371:1392-406.
- Duckworth W, Abraira C, Moritz T, et al. Glucose control and vascular complications in veterans with type 2 diabetes. N Engl J Med 2009;360:129-39.
- Moritz T, Duckworth W, Abraira C. Veterans Affairs diabetes trial-corrections. N Engl J Med 2009;361:1024-5.
- Hayward RA, Reaven PD, Wiitala WL, et al. Follow-up of glycemic control and cardiovascular outcomes in type 2 diabetes. New Engl J Med 2015;372:2197-206.
- Fang HJ, Zhou YH, Tian YJ, et al. Effects of intensive glucose lowering in treatment of type 2 diabetes mellitus on cardiovascular outcomes: A meta-analysis of data from 58,160 patients in 13 randomized controlled trials. Int J Cardiol 2016;218:50-8
- Calles-Escandon J, Lovato LC, Simons-Morton DG, et al. Effect of intensive compared with standard glycemia treatment strategies on mortality by baseline subgroup characteristics: The Action to Control Cardiovascular Risk in Diabetes (ACCORD) trial. Diabetes Care 2010;33:721-7.
- Bonds DE, Miller ME, Bergenstal RM, et al. The association between symptomatic, severe hypoglycaemia and mortality in type 2 diabetes: Retrospective epidemiological analysis of the ACCORD study. BMJ 2010;340:b4909.
- Zoungas S, Patel A, Chalmers J, et al. Severe hypoglycemia and risks of vascular events and death. N Engl J Med 2010;363:1410-18.
- Vijan S, Sussman JB, Yudkin JS, et al. Effect of patients’ risks and preferences on health gains with plasma glucose level lowering in type 2 diabetes mellitus. JAMA Intern Med 2014;174:1227-34.
- Lipska KJ, Ross JS, Miao Y, et al. Potential overtreatment of diabetes mellitus in older adults with tight glycemic control. JAMA Intern Med 2015;175:356-62.
- Gaede P, Oellgaard J, Carstensen B, et al. Years of life gained by multifactorial intervention in patients with type 2 diabetes mellitus and microalbuminuria: 21 years follow-up on the Steno-2 randomised trial. Diabetologia 2016;59:2298-307.
- Wei N, Zheng H, Nathan DM. Empirically establishing blood glucose targets to achieve HbA1c goals. Diabetes Care 2014;37:1048-51.
- Nathan DM, Kuenen J, Borg R, et al. Translating the A1C assay into estimated average glucose values. Diabetes Care 2008;31:1473-8.
- Monnier L, Lapinski H, Colette C. Contributions of fasting and postprandial plasma glucose increments to the overall diurnal hyperglycemia of type 2 diabetic patients: Variations with increasing levels of HbA(1c). Diabetes Care 2003;26:881-5.
- Woerle HJ, Neumann C, Zschau S, et al. Impact of fasting and postprandial glycemia on overall glycemic control in type 2 diabetes Importance of postprandial glycemia to achieve target HbA1c levels. Diabetes Res Clin Pract 2007;77:280-5.
- Riddle M, Umpierrez G, DiGenio A, et al. Contributions of basal and postprandial hyperglycemia over a wide range of A1C levels before and after treatment intensification in type 2 diabetes. Diabetes Care 2011;34:2508-14.
- Monnier L, Colette C, Dunseath GJ, et al. The loss of postprandial glycemic control precedes stepwise deterioration of fasting with worsening diabetes. Diabetes Care 2007;30:263-9.
- Bolli GB, Riddle MC, Bergenstal RM, et al. New insulin glargine 300 U/ml compared with glargine 100 U/ml in insulin-naive people with type 2 diabetes on oral glucose-lowering drugs: A randomized controlled trial (EDITION 3). Diabetes Obes Metab 2015;17:386-94.
- Gerstein HC, Yale JF, Harris SB, et al. A randomized trial of adding insulin glargine vs. avoidance of insulin in people with type 2 diabetes on either no oral glucoselowering agents or submaximal doses of metformin and/or sulphonylureas. The Canadian INSIGHT (Implementing New Strategies with Insulin Glargine for Hyperglycaemia Treatment) study. Diabet Med 2006;23:736-42.
- Yki-Järvinen H, Juurinen L, Alvarsson M, et al. Initiate insulin by aggressive titration and education (INITIATE): A randomized study to compare initiation of insulin combination therapy in type 2 diabetic patients individually and in groups. Diabetes Care 2007;30:1364-9.
- Yki-Järvinen H, Kauppinen-Mäkelin R, Tiikkainen M, et al. Insulin glargine or NPH combined with metformin in type 2 diabetes: The LANMET study. Diabetologia 2006;49:442-51.
- Davies M, Storms F, Shutler S, et al. Improvement of glycemic control in subjects with poorly controlled type 2 diabetes: Comparison of two treatment algorithms using insulin glargine. Diabetes Care 2005;28:1282-8.
- Riddle MC, Rosenstock J, Gerich J. The treat-to-target trial: Randomized addition of glargine or human NPH insulin to oral therapy of type 2 diabetic patients. Diabetes Care 2003;26:3080-6.
- Heller S, Buse J, Fisher M, et al. Insulin degludec, an ultra-longacting basal insulin, versus insulin glargine in basal-bolus treatment with mealtime insulin aspart in type 1 diabetes (BEGIN Basal-Bolus Type 1): A phase 3, randomised, openlabel, treat-to-target non-inferiority trial. Lancet 2012;379:1489-97.
- Holman RR, Farmer AJ, Davies MJ, et al. Three-year efficacy of complex insulin regimens in type 2 diabetes. N Engl J Med 2009;361:1736-47.
- Esposito K, Giugliano D, Nappo F, et al. Regression of carotid atherosclerosis by control of postprandial hyperglycemia in type 2 diabetes mellitus. Circulation 2004;110:214-19.
- Raz I,Wilson PW, Strojek K, et al. Effects of prandial versus fasting glycemia on cardiovascular outcomes in type 2 diabetes: The HEART2D trial. Diabetes Care 2009;32:381-6.
- Selvin E, Rawlings AM, Lutsey PL, et al. Fructosamine and glycated albumin and the risk of cardiovascular outcomes and death. Circulation 2015;132:269-77.
- FLAT-SUGAR Trial Investigators. Glucose variability in a 26-week randomized comparison of mealtime treatment with rapid-acting insulin versus GLP-1 agonist in participants with type 2 diabetes at high cardiovascular risk. Diabetes Care 2016;39:973-81.
- Lin CC, Li CI, Yang SY, et al. Variation of fasting plasma glucose: A predictor of mortality in patients with type 2 diabetes. Am J Med 2012;125:416, e9-18.
- Moher D, Liberati A, Tetzlaff J, et al. Preferred reporting items for systematic reviews and meta-analyses: The PRISMA statement. PLoS Med 2009;6:e1000097.
Diabetes Canada is the registered owner of all content on guidelines.diabetes.ca and ShopDC. For questions, please email info@diabetes.ca